
The most effective approach to minimising healthcare employee turnover is a bundled, data-driven retention programme that combines leadership and culture reform, workload redesign, structured career pathways and a tight first-90-days onboarding plan. No single fix works in isolation. A realist synthesis of UK retention evidence confirms that coordinated bundles addressing workload, staff support and staff involvement in policy consistently outperform single-point interventions. Start this month by pulling your ESR turnover data by role and tenure, then schedule a staff listening event to surface the top three local drivers.
Your highest-impact actions to begin immediately:
- Pull ESR turnover data segmented by role, ward and length of service to identify your highest-risk cohorts.
- Schedule a structured staff listening forum within the next four weeks and commit to a written response within 21 days.
- Audit your current onboarding process and assign a named buddy to every new starter from day one.
- Review your rota for the past three months: count mandatory overtime incidents and identify the wards where agency spend is highest.
- Map at least one visible career pathway for your most common clinical role, with named progression milestones.
Single next task: run a 90-day retention data review, then book a retention masterclass or listening event with your clinical leads before the end of the quarter.
Key takeaways
Bundled, data-driven retention programmes that combine leadership reform, workload redesign, structured career pathways and tight onboarding consistently produce the largest and most durable reductions in healthcare staff turnover.
| Point | Details |
|---|---|
| Bundles outperform single fixes | Coordinated interventions across culture, workload, development and wellbeing produce sustained retention gains. |
| RDSP evidence is compelling | The programme was associated with a 4.49% reduction in nurse turnover and a 3.45% reduction in 30-day mortality. |
| The first 90 days are decisive | Structured induction with buddy assignment and pulse surveys at days 14, 60 and 90 reduces early exits. |
| Segment by career stage | Early-career staff respond to development; later-career staff respond to flexibility and management responsiveness. |
| Measure consistently | Track turnover rate, 90-day retention, agency spend and staff survey scores monthly using ESR and exit interview data. |
For templates and further reading, the sources listed below are the most practical starting points for UK healthcare managers.
Table of Contents
- Why does high turnover cost UK healthcare so much?
- What does the UK evidence actually show about retention?
- How do leadership and staff voice reduce turnover?
- Can rostering reform genuinely reduce staff exits?
- What does flexible working actually look like in practice?
- How do career pathways keep healthcare staff engaged?
- Why do the first 90 days determine whether new staff stay?
- How does staff wellbeing connect to retention?
- Should you tailor retention strategies by career stage?
- What KPIs should you track to measure retention progress?
- What does a practical 90/180/365-day roadmap look like?
- Sources
- FAQ
Why does high turnover cost UK healthcare so much?
The financial and patient-safety consequences of high staff turnover in UK healthcare are substantial. Recruiting, onboarding and training a single registered nurse costs the NHS thousands of pounds in direct costs alone, before accounting for agency cover, overtime premiums and the productivity dip that accompanies every vacancy. The NHS Long Term Workforce Plan models that sustained action on retention, training and productivity could reduce projected leavers by between 55,000 and 128,000 full-time equivalents over a 15-year period — a figure that illustrates just how much workforce instability compounds over time if left unaddressed.
Beyond the balance sheet, turnover directly affects care quality. Understaffed wards rely more heavily on agency workers who are unfamiliar with local protocols, which raises clinical risk. The RDSP evaluation (discussed in detail below) found a measurable reduction in 30-day post-admission mortality associated with clinically led retention work, which is a striking signal that keeping experienced staff in post has consequences well beyond HR metrics.
A worked example makes the business case concrete. If a 200-bed ward loses eight nurses in a year and each vacancy costs roughly £6,000–£8,000 in agency cover and recruitment, the annual bill reaches £48,000–£64,000 before training costs are added. Redirecting even a fraction of that spend into structured retention activity — a rota software upgrade, a wellbeing programme, protected CPD time — typically delivers a faster return than another recruitment campaign.
What does the UK evidence actually show about retention?
The clearest lesson from UK evaluations is that bundles of coordinated interventions, not individual policies, produce sustained reductions in turnover. The evidence also shows that local tailoring matters: a nationally designed programme delivered without reference to local workforce data tends to underperform.
The Retention and Deployment Support Programme
The strongest UK case evidence comes from the Retention and Deployment Support Programme (RDSP), a clinically led initiative rolled out across English NHS hospitals. An independent evaluation found that the RDSP was associated with a 4.49% reduction in nurse turnover, a 5.38% reduction in exits from the public hospital sector and a 3.45% reduction in 30-day post-admission mortality. Those are not marginal gains. The mortality finding in particular underlines that workforce stability is a patient safety issue, not merely an HR one.
The RDSP worked through three mechanisms: national data packs that showed each trust its own turnover profile benchmarked against regional peers; retention masterclasses where clinical leaders analysed that data and designed locally tailored action plans; and structured follow-up to monitor progress. The combination of data transparency, clinical ownership and local accountability was what made it effective.
Key principles drawn from the RDSP and wider UK evidence:
- Use your own workforce data as the starting point, not a generic national template.
- Involve clinical leaders, not just HR, in designing and owning the plan.
- Commit to follow-up: a one-off masterclass without monitoring loses its effect within months.
- Address multiple domains simultaneously (workload, culture, development, wellbeing) rather than picking one.
Pro Tip: You can replicate a scaled-down retention masterclass locally. Pull your ESR data, benchmark it against NHS national averages, present the gap to your clinical leads in a 90-minute workshop, and ask each team to name their top two retention risks and one action they will own. Document the outputs and review them at 90 days.
How do leadership and staff voice reduce turnover?
Shared governance, visible supportive leadership and structured listening produce measurable falls in turnover. Staff who feel heard and who see their feedback translated into action are significantly less likely to leave. Pay often functions as a proxy for feeling valued — but research on NHS leavers consistently shows that intrinsic factors such as professional respect, development opportunities and managerial responsiveness matter as much as pay for longer-term retention.
Practical actions for managers:
- Establish a monthly structured listening forum with rotating staff representation across grades and shift patterns.
- Create a shared governance council that gives clinical staff a formal role in rostering, policy and service design decisions.
- Map every piece of staff feedback to a named action owner and a deadline, then publish the outcome.
- Make one-to-one check-ins a protected diary commitment, not an optional extra.
One-to-one template questions to surface retention risks:
- What is the one thing that, if changed, would make your role more sustainable?
- Have you considered leaving in the past three months? If yes, what was the main reason?
- Do you feel your development is progressing at the pace you expected?
- Is there anything about the team dynamic or workload that is affecting your wellbeing?
- What would make you recommend this organisation to a colleague?
Closing the feedback loop is where most organisations fall short. Collecting staff views without visible follow-through actively damages trust and accelerates turnover. Assign a named lead to each theme raised, set a 30-day response deadline and share outcomes at the next team meeting.
Can rostering reform genuinely reduce staff exits?
Controlling overtime and improving rostering are among the highest-impact, lowest-cost levers available to a healthcare manager. Excessive mandatory overtime is one of the most cited reasons staff give for leaving, and it is also one of the most directly controllable. Compliance with staffing regulations and transparent rota management reduce both burnout risk and the legal exposure that comes with unsafe staffing levels.
Tactical steps to implement now:
- Audit mandatory overtime incidents over the past 90 days by ward and role.
- Set a target to reduce mandatory overtime by a specific percentage within 90 days and assign a rota lead to own it.
- Introduce a bank staff pool as a first-call resource before agency, reducing cost and improving team familiarity.
- Formalise time-off-in-lieu policies so staff trust that extra hours will be recognised.
- Review shift patterns for equity: night-heavy or weekend-heavy rotas concentrated on junior staff drive early exits.
Rostering checklist — immediate review items:
- Pull the last quarter’s agency spend by ward and identify the top three cost centres.
- Map the ratio of bank to agency use: a high agency ratio signals a bank staff recruitment gap.
- Check whether shift-swap requests are being processed within 48 hours — delays erode goodwill quickly.
- Identify any staff working more than two consecutive long shifts and flag for a welfare conversation.
- Review whether annual leave is being taken or accumulated: large leave balances signal burnout risk.
A modest investment in rota software or an additional bank staff coordinator typically pays back within one or two quarters through reduced agency spend. The cost-versus-saving case is straightforward to model for a local business case.
What does flexible working actually look like in practice?
Flexible, reliable working arrangements lower early exits and improve retention, particularly for staff with caring responsibilities, those seeking part-time roles and those approaching retirement. The key word is reliable: ad hoc flexibility that depends on a manager’s goodwill each week is not the same as a contractual arrangement staff can plan their lives around.
Flexible models worth implementing:
- Job-sharing: two part-time staff share one full-time senior role, with overlapping handover time built in.
- Compressed hours: a full-time week delivered in four longer shifts rather than five, popular with staff who commute.
- Annualised hours: total contracted hours are fixed annually, with variation across seasons — useful for services with predictable demand peaks.
- Phased retirement: senior staff reduce their contracted hours over 12–24 months rather than leaving abruptly, retaining institutional knowledge.
- Sabbatical pathways: a structured leave option for staff at five or ten years’ service, with a guaranteed return-to-role commitment.
Two role redesign examples managers can adapt:
- Clinical role with protected development time: a band 5 nurse works four clinical shifts per week and one protected half-day for CPD, mentorship or quality improvement work. The protected time is written into the job plan, not offered informally.
- Part-time senior clinician job-share: two band 7 practitioners each work 22.5 hours, with a shared caseload, joint supervision sessions and a single line manager. Handover documentation is standardised to prevent duplication.
Implementation notes: contractual changes require HR sign-off and may affect pension contributions, so involve payroll early. Rostering systems need to accommodate non-standard patterns without defaulting to manual workarounds, which erode the benefit. Communicate changes to the whole team to prevent perceptions of favouritism.
How do career pathways keep healthcare staff engaged?
Visible, funded career pathways and protected learning time are strong retention drivers, particularly for staff in the first five years of their career. When staff cannot see a clear route forward, they look for one elsewhere. Dementia care training is one practical example of role-specific CPD that builds both competence and commitment — staff who are invested in through specialist training tend to stay longer and perform better.
Operational steps:
- Map the career pathway for each major role group from entry level through to advanced practice, consultant or educator roles.
- Create local apprenticeship routes and advanced clinical practice pathways in partnership with your regional integrated care board.
- Budget for protected CPD time: at least one half-day per month per clinical staff member is a reasonable minimum.
- Establish a mentorship scheme pairing early-career staff with experienced practitioners.
- Track internal promotion rates quarterly and use them as a retention KPI.
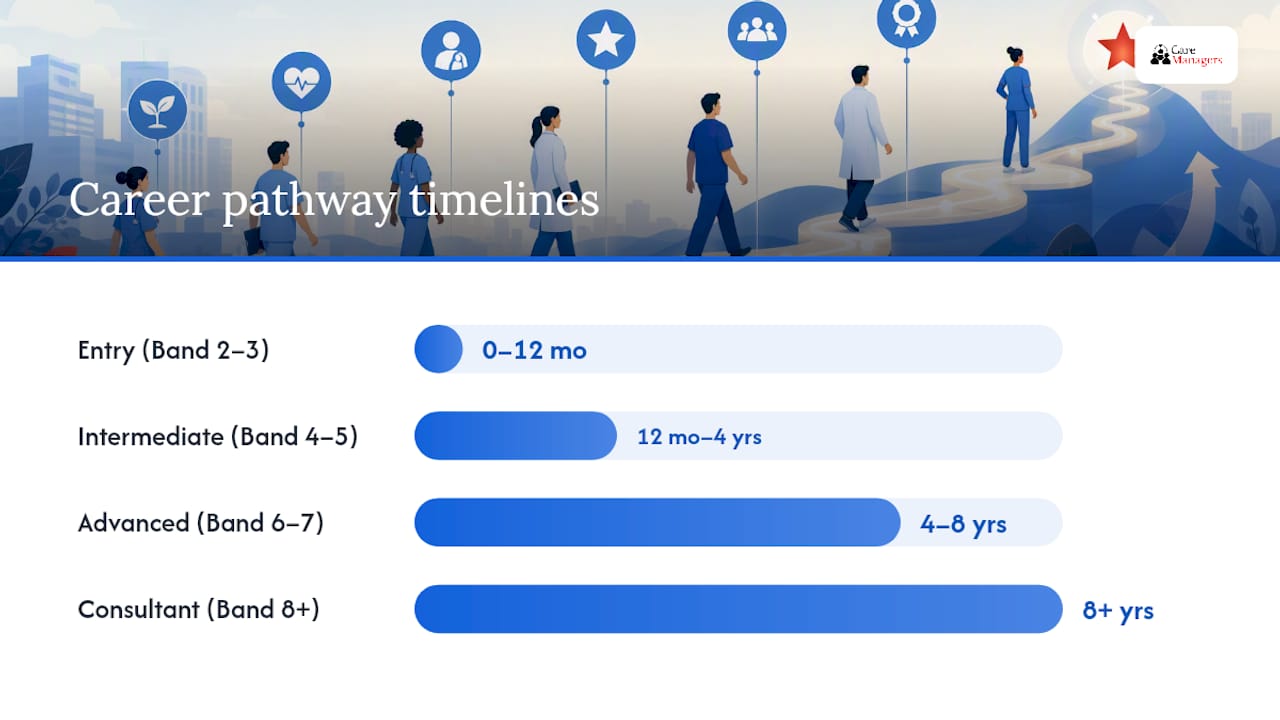
Example career pathway schematic (adaptable):
| Stage | Role example | Development focus | Typical timeline |
|---|---|---|---|
| Entry | Band 2–3 care support worker | Induction, core skills, NVQ Level 2/3 | 0–12 months |
| Intermediate | Band 4–5 clinical role | Specialist training, mentorship, NVQ Level 4/5 | 12 months–4 years |
| Advanced | Band 6–7 specialist or team lead | Leadership programme, advanced practice modules | 4–8 years |
| Consultant/Educator | Band 8+ or advanced practitioner | Research, teaching, service design | 8+ years |

Measuring ROI: track retention rates by cohort (those who completed a development programme versus those who did not), CPD uptake as a percentage of eligible staff, and the ratio of internal promotions to external hires. A rising internal promotion rate is one of the clearest signals that your career pathway is working.
Why do the first 90 days determine whether new staff stay?
The first 90 days are critical. Structured induction and regular check-ins during this window reduce early turnover more reliably than almost any other single intervention. A strong first-90-days induction that includes buddy systems and structured one-to-ones prevents the early-exit pattern that costs organisations so much in repeat recruitment.
90-day onboarding timeline:
- Day 1: Named buddy assigned, workspace ready, IT access confirmed, team introduction completed.
- Week 1: Line manager one-to-one, role expectations agreed, first competency sign-off scheduled.
- Week 2–4: Weekly check-ins with buddy; first pulse survey sent at day 14.
- Month 2: Formal mid-point review with line manager; any concerns documented and actioned within five working days.
- Day 60: Second pulse survey; buddy relationship reviewed and extended or transitioned as appropriate.
- Day 90: End-of-probation review, competency sign-offs completed, development plan agreed for months 4–12.
Manager checklist for the first 90 days:
- Confirm buddy assignment before the new starter’s first day.
- Send pulse surveys at days 14, 60 and 90 — keep them to five questions maximum.
- Set a calendar reminder for each check-in so they are never cancelled without rescheduling.
- Flag any new starter who misses two or more shifts in the first month for a welfare conversation.
- Feed onboarding pulse survey data into your wider retention dashboard monthly.
Linking onboarding data to your broader retention metrics is straightforward: track 90-day retention rates by role and hiring cohort, and compare them quarter on quarter. A falling 90-day retention rate is an early warning signal that something in the induction process needs fixing before it becomes a recruitment crisis.
How does staff wellbeing connect to retention?
Comprehensive wellbeing support and active anti-discrimination policies reduce intentions to leave and support retention across all staff groups. Large cross-sectional analyses link depression, anxiety and burnout with significantly higher odds of intending to leave; higher work engagement consistently correlates with lower attrition. Wellbeing is not a soft add-on — it is a retention lever with measurable impact.
Core wellbeing offers to put in place:
- Accessible occupational health with referral pathways that staff can self-initiate.
- Confidential counselling through an Employee Assistance Programme (EAP) with a minimum of six sessions.
- Peer support networks, particularly for staff in high-pressure or emotionally demanding roles.
- Protected clinical supervision for all registered practitioners, not just those in training.
- Clear return-to-work pathways for staff returning from mental health-related absence.
One finding that surprises many managers: workplace aggression from colleagues is a stronger predictor of intention to leave than patient-facing aggression. Peer-to-peer bullying and interpersonal hostility erode on-the-job embeddedness faster than almost any other factor. Treat interpersonal culture as a primary retention lever, not a secondary HR matter.
Actions to reduce peer aggression:
- Implement a zero-tolerance policy with a clear, accessible reporting process.
- Train line managers in restorative approaches to conflict resolution.
- Monitor incidence reports monthly and include them in your retention dashboard.
- Use staff survey data to track whether staff feel safe raising concerns — a falling score here is a leading indicator of turnover risk.
Pro Tip: Run a quarterly wellbeing utilisation audit: check what percentage of eligible staff have accessed the EAP, occupational health or peer support in the past 90 days. Low uptake often signals stigma or poor awareness, not low need. A targeted awareness campaign can double utilisation within one quarter.
Should you tailor retention strategies by career stage?
Different career stages have different retention drivers, and age-specific actions improve the effectiveness of your retention spend. Systematic review evidence confirms that younger clinical staff respond most strongly to organisational engagement and development opportunities, while staff over 50 respond more to management responsiveness and targeted later-career support. A single undifferentiated retention programme will underserve both groups.
Interventions by career stage:
- Early career (0–5 years): structured buddying, protected development time, visible promotion pathways and regular one-to-ones with a senior mentor. This group is most at risk of early exit and most responsive to feeling invested in.
- Mid-career (5–15 years): opportunities for role diversification, secondments, leadership development and involvement in service improvement. Mid-career staff often leave because they feel stuck, not because they are unhappy with the work itself.
- Later career (15+ years or approaching retirement): flexible and phased retirement options, role tapering, opportunities to mentor junior colleagues and recognition of accumulated expertise. Losing this group to abrupt retirement is one of the most preventable forms of knowledge loss.
How to identify high-risk cohorts using local data:
- Segment your ESR turnover data by age band, role and length of service.
- Identify the cohort with the highest 12-month leaver rate and the highest vacancy rate.
- Cross-reference with staff survey scores for that cohort: low engagement scores in a high-leaver group confirm the risk.
- Design a targeted intervention for that cohort first, then evaluate before rolling out more broadly.
A segmented approach is more efficient than a broad programme because it concentrates resources where the retention return is highest.
What KPIs should you track to measure retention progress?
Measuring retention properly requires a small, consistent set of KPIs tracked at regular intervals and linked directly to your interventions. The NHS Employers retention toolkit places workforce data at the centre of any locally tailored retention plan, and recommends using it to set baselines, targets and review cycles.
Suggested KPI framework:
| KPI | Data source | Reporting cadence | Target direction |
|---|---|---|---|
| Overall turnover rate (%) by role | ESR | Monthly | Downward |
| Early turnover rate (leavers within 12 months, %) | ESR / HR records | Quarterly | Downward |
| 90-day retention rate by cohort | Onboarding records | Quarterly | Upward |
| Vacancy days by ward/team | ESR / rota system | Monthly | Downward |
| Agency spend as % of total staffing cost | Finance | Monthly | Downward |
| Staff survey engagement score | Annual / pulse surveys | Quarterly | Upward |
| Wellbeing service utilisation rate | EAP / OH records | Quarterly | Upward |
Simple evaluation framework:
- Baseline: establish your current position on each KPI before any intervention begins.
- Target: set a realistic improvement target for 90, 180 and 365 days.
- Measure: collect data at each reporting point and compare against baseline and target.
- Adjust: if a KPI is not moving in the right direction at 90 days, review the intervention, not just the data.
Reporting should be owned by a named lead (typically the HR director or workforce manager), reviewed monthly at operational level and quarterly at board level. Exit interview data and pulse survey results should feed into the same dashboard so that qualitative signals sit alongside quantitative ones.
What does a practical 90/180/365-day roadmap look like?
A prioritisation matrix helps you sequence actions by impact and feasibility. High-impact, low-effort actions come first; high-impact, high-effort actions are planned carefully and resourced properly before launch. Avoid the common mistake of starting with the most visible initiative rather than the most effective one.
90-day actions (quick wins, high impact):
- Pull ESR data and segment by role, age and tenure. Owner: HR lead. Resource: 4–6 hours of analyst time.
- Schedule a staff listening forum. Owner: service manager. Resource: 2 hours of facilitation time.
- Assign buddies to all new starters and implement the 90-day onboarding checklist. Owner: ward/team managers. Resource: buddy training half-day.
- Audit mandatory overtime and set a reduction target. Owner: rota lead. Resource: rota system access.
- Launch or promote the EAP to all staff with a named contact. Owner: HR. Resource: communications budget.
180-day actions (medium effort, sustained impact):
- Map career pathways for the top three role groups and publish them internally.
- Introduce structured one-to-one templates for all line managers.
- Review and formalise flexible working policies, including job-share and phased retirement options.
- Set up a shared governance council with staff representation across grades.
- Begin tracking the KPI framework above and present the first quarterly report.
365-day actions (higher investment, longer return):
- Launch a local apprenticeship or advanced practice route in partnership with your integrated care board.
- Embed retention masterclass methodology: annual data review, clinical lead workshop, updated action plan.
- Evaluate the impact of 90- and 180-day actions using the baseline data collected in month one.
- Present a retention impact report to the board, including cost savings from reduced agency spend.
Resource estimate template: for a team of 50 clinical staff, a realistic first-year retention programme requires approximately 20–30 hours of HR lead time per month, a small communications budget for staff engagement, access to ESR data, and a modest CPD budget. The comparison between temporary and permanent staffing models is worth reviewing when making the business case for reducing agency reliance.
What managers usually get wrong about retention
The most common mistake is treating retention as a project rather than an operational discipline. A trust runs a listening event, produces an action plan, and then the plan sits in a shared drive while the pressures of day-to-day service delivery take over. Six months later, turnover is unchanged and staff are more cynical than before — because they were asked for their views and nothing happened.
Funding cycles compound this. Retention initiatives often get resourced in one financial year and quietly defunded in the next, before the evidence of impact has had time to accumulate. The RDSP evaluation is instructive here: the measured reductions in turnover and mortality emerged from sustained, clinically led programmes, not from one-off events.
Three pitfalls to avoid:
- Ignoring local data in favour of national templates. A national toolkit is a starting point, not a plan. Your turnover profile is specific to your workforce, your geography and your service model.
- Poor follow-through on feedback. Collecting staff views without visible action is worse than not asking at all. It signals that the exercise was performative.
- Siloing retention in HR. Retention is a clinical leadership responsibility as much as an HR one. If your clinical leads do not own part of the plan, the plan will not hold.
Pro Tip: Build retention metrics into your monthly operational dashboard alongside activity, finance and quality data. When turnover sits next to agency spend and vacancy days in the same report, it stops being an HR metric and becomes a service management issue — which is exactly what it is.
Sources
- Non‑monetary interventions, workforce retention and hospital quality: evidence from the English NHS
- NHS long term workforce plan v1.2
- Organisational factors associated with healthcare workforce development, recruitment, and retention in the United Kingdom: a systematic review
- Organisational factors associated with healthcare workforce development, recruitment, and retention in the United Kingdom: a systematic review | BMC Nursing
FAQ
What are the five most effective retention strategies in healthcare?
The five highest-impact strategies are: bundled interventions (combining culture, workload, development and wellbeing); structured onboarding with buddying in the first 90 days; visible career pathways with protected CPD time; rostering reform to reduce mandatory overtime; and active wellbeing support including confidential counselling and peer networks. UK evidence confirms that no single strategy works as well as a coordinated combination of these.
Is a 30% turnover rate bad in healthcare?
What are the three R’s of employee retention?
The three R’s commonly referenced in retention literature are Respect, Recognition and Reward. In a healthcare context, respect means professional autonomy and manageable workloads; recognition means visible acknowledgement of contribution; and reward encompasses both pay and non-monetary benefits such as development opportunities and flexible working. Research on NHS leavers shows that respect and recognition often matter more than pay for long-term retention.
How do you measure the impact of retention interventions?
Track a small set of KPIs monthly: overall turnover rate by role, 90-day retention rate by cohort, agency spend as a percentage of total staffing cost, and staff survey engagement scores. Use ESR as your primary data source, supplement with exit interview themes and pulse survey results, and compare each metric against the baseline you established before the intervention began. Review at 90, 180 and 365 days.
What is the single quickest win for reducing early staff exits?
Assigning a named buddy to every new starter before their first day, combined with a structured check-in at day 14, is the quickest and lowest-cost action with the clearest evidence base. Early exits are disproportionately concentrated in the first three months, and a buddy relationship with regular manager check-ins addresses the two most common causes: feeling unsupported and feeling unclear about expectations.